
What Hawaii's Housing Market Taught Me About Fundamentals
Sometimes you have to cross an ocean to see how consistent the dynamics really are


Last week marked a first for me: my first on-site assignment in Hawaii.
Fourteen hours of flying each way. Forty-eight hours on the Big Island. A compressed timeline to validate market analysis and inspect properties in person—applying methodology I’ve used for 30 years to a market I’d studied remotely but never walked.
“You can’t compress the hours in a day, and you can’t replace boots-on-the-ground observation with data alone.”
I’ve spent four decades analyzing housing markets across the country. From dense urban cores in New York and Boston to rural communities in Montana, including mainland island markets where geographic constraints create similar dynamics. I’ve seen how neighborhoods transition, how policy shapes supply, how demand pressure moves across boundary lines. Island economics—limited land, supply chain challenges, seasonal dynamics—aren’t new territory. But there’s something about being 5,000 miles from your home base, walking properties instead of reviewing data remotely, that creates a particular kind of clarity.
The Big Island reminded me that you can drive from active volcano to rainforest to desert to ocean within an hour. Extreme microclimates exist side by side—dramatic shifts in conditions across a single boundary line.
Not unlike housing markets everywhere.
“The fundamentals are consistent. Supply constraints, demand pressure, policy lag—they show up everywhere, just wearing different clothes.”
Clarendon recently announced our first Texas contract with Opportunity Home San Antonio, the largest housing authority in Texas. We also signed our first major brokerage contract with a top 5 public housing authority. After 30 years of operating primarily in the Northeast, these expansions feel both overdue and carefully timed.
But here’s what Hawaii taught me that matters more than any single contract: supply constraints, demand pressure, and policy lag show up everywhere, creating similar challenges across different contexts.
The Assignment: Validating Analysis on the Ground
The work was straightforward on paper: validate market analysis for a housing portfolio on the Big Island. Evaluate comparable properties, assess market rates, understand occupancy dynamics, identify opportunities and risks.
Standard methodology. Unique context.
I’d already conducted preliminary market analysis using the same tools I use for any market assessment. The fundamentals were clear from the data: Hawaii consistently ranks among the most expensive housing markets in the nation. The median home price in Hawaii hovers around $830,000—more than double the national median. Rental markets tell the same story: limited supply, high demand, prices that make “affordable” a relative term.
But data alone doesn’t tell you everything. Numbers don’t capture how scarcity shapes daily operations, how geography constrains development in ways that compound over time, how properties perform relative to market expectations.
The site visit wasn’t about learning the market from scratch—it was about validating what the data suggested and understanding what it didn’t show.
What You See From 30,000 Feet
There’s something about being physically present in a market—even one you’ve analyzed remotely—that creates different perspective. At 30,000 feet over the Pacific, patterns that can blur in routine work become visible again.

I’ve been tracking housing markets since 1984. I’ve watched neighborhoods transition from declining to thriving, seen policy changes reshape entire submarkets, identified value opportunities before they became obvious to the broader market. That’s the work: pattern recognition across time and space.
But patterns get harder to see when you’re embedded in them. When you’re operating in the same geographic markets year after year, the incremental changes blend together. You can miss the forest for the trees—or more accurately, you can miss the fundamental dynamics for the local variations.
Hawaii forced perspective in a way that felt almost uncomfortably clear.
Land Scarcity: A Familiar Dynamic at Scale
Let’s start with what everyone knows: Hawaii is an island chain in the middle of the Pacific Ocean. Land is finite in a way that’s fundamentally different from mainland markets.

I’ve worked island markets before where geographic constraints create similar pressures. On islands, you can’t build past the shoreline. You can’t expand into adjacent counties. The boundary is the ocean, and the ocean doesn’t negotiate.
But Hawaii operates at a different scale, yet the constraints feel even tighter because of topography, lava zones, conservation land, and the sheer distance from mainland supply chains.
This creates a baseline housing cost that’s structurally higher than comparable mainland markets. Not because of demand alone, but because supply can never meaningfully expand beyond existing developable land.
For housing providers, this matters enormously. Acquisition costs are higher. Development feasibility is constrained. The math that works in Houston or Atlanta simply doesn’t work in Honolulu or Hilo.
But here’s what surprised me: the dynamics aren’t actually different. They’re just more visible.
The Fundamentals: Supply, Demand, Policy
Every housing market operates on the same core fundamentals:
Supply: How much housing exists and how much can realistically be added
Demand: How many people need housing and at what price points they can afford it
Policy: The regulatory and funding environment that shapes both supply and demand
In most mainland markets, these three forces interact in complex ways that can be hard to untangle. Supply constraints might be regulatory (zoning, permitting) or practical (labor, materials) or financial (construction costs, lending). Demand varies by submarket, by season, by economic conditions. Policy operates at federal, state, and local levels, often pulling in different directions.
Hawaii strips away some of that complexity. The supply constraint is geographic and therefore easier to see. The demand drivers are clear: limited housing supply + desirable location + relatively stable population = sustained price pressure. Policy matters, but it operates within constraints that are more rigid than most mainland markets face.
What this revealed to me: the fundamentals I see everywhere are always at work. In most markets, they’re just buried under layers of local variation.
Microclimates and Market Boundaries
One afternoon between site visits, I drove from Kailua-Kona on the west side of the Big Island toward Hilo on the east. The landscape changed every fifteen minutes.
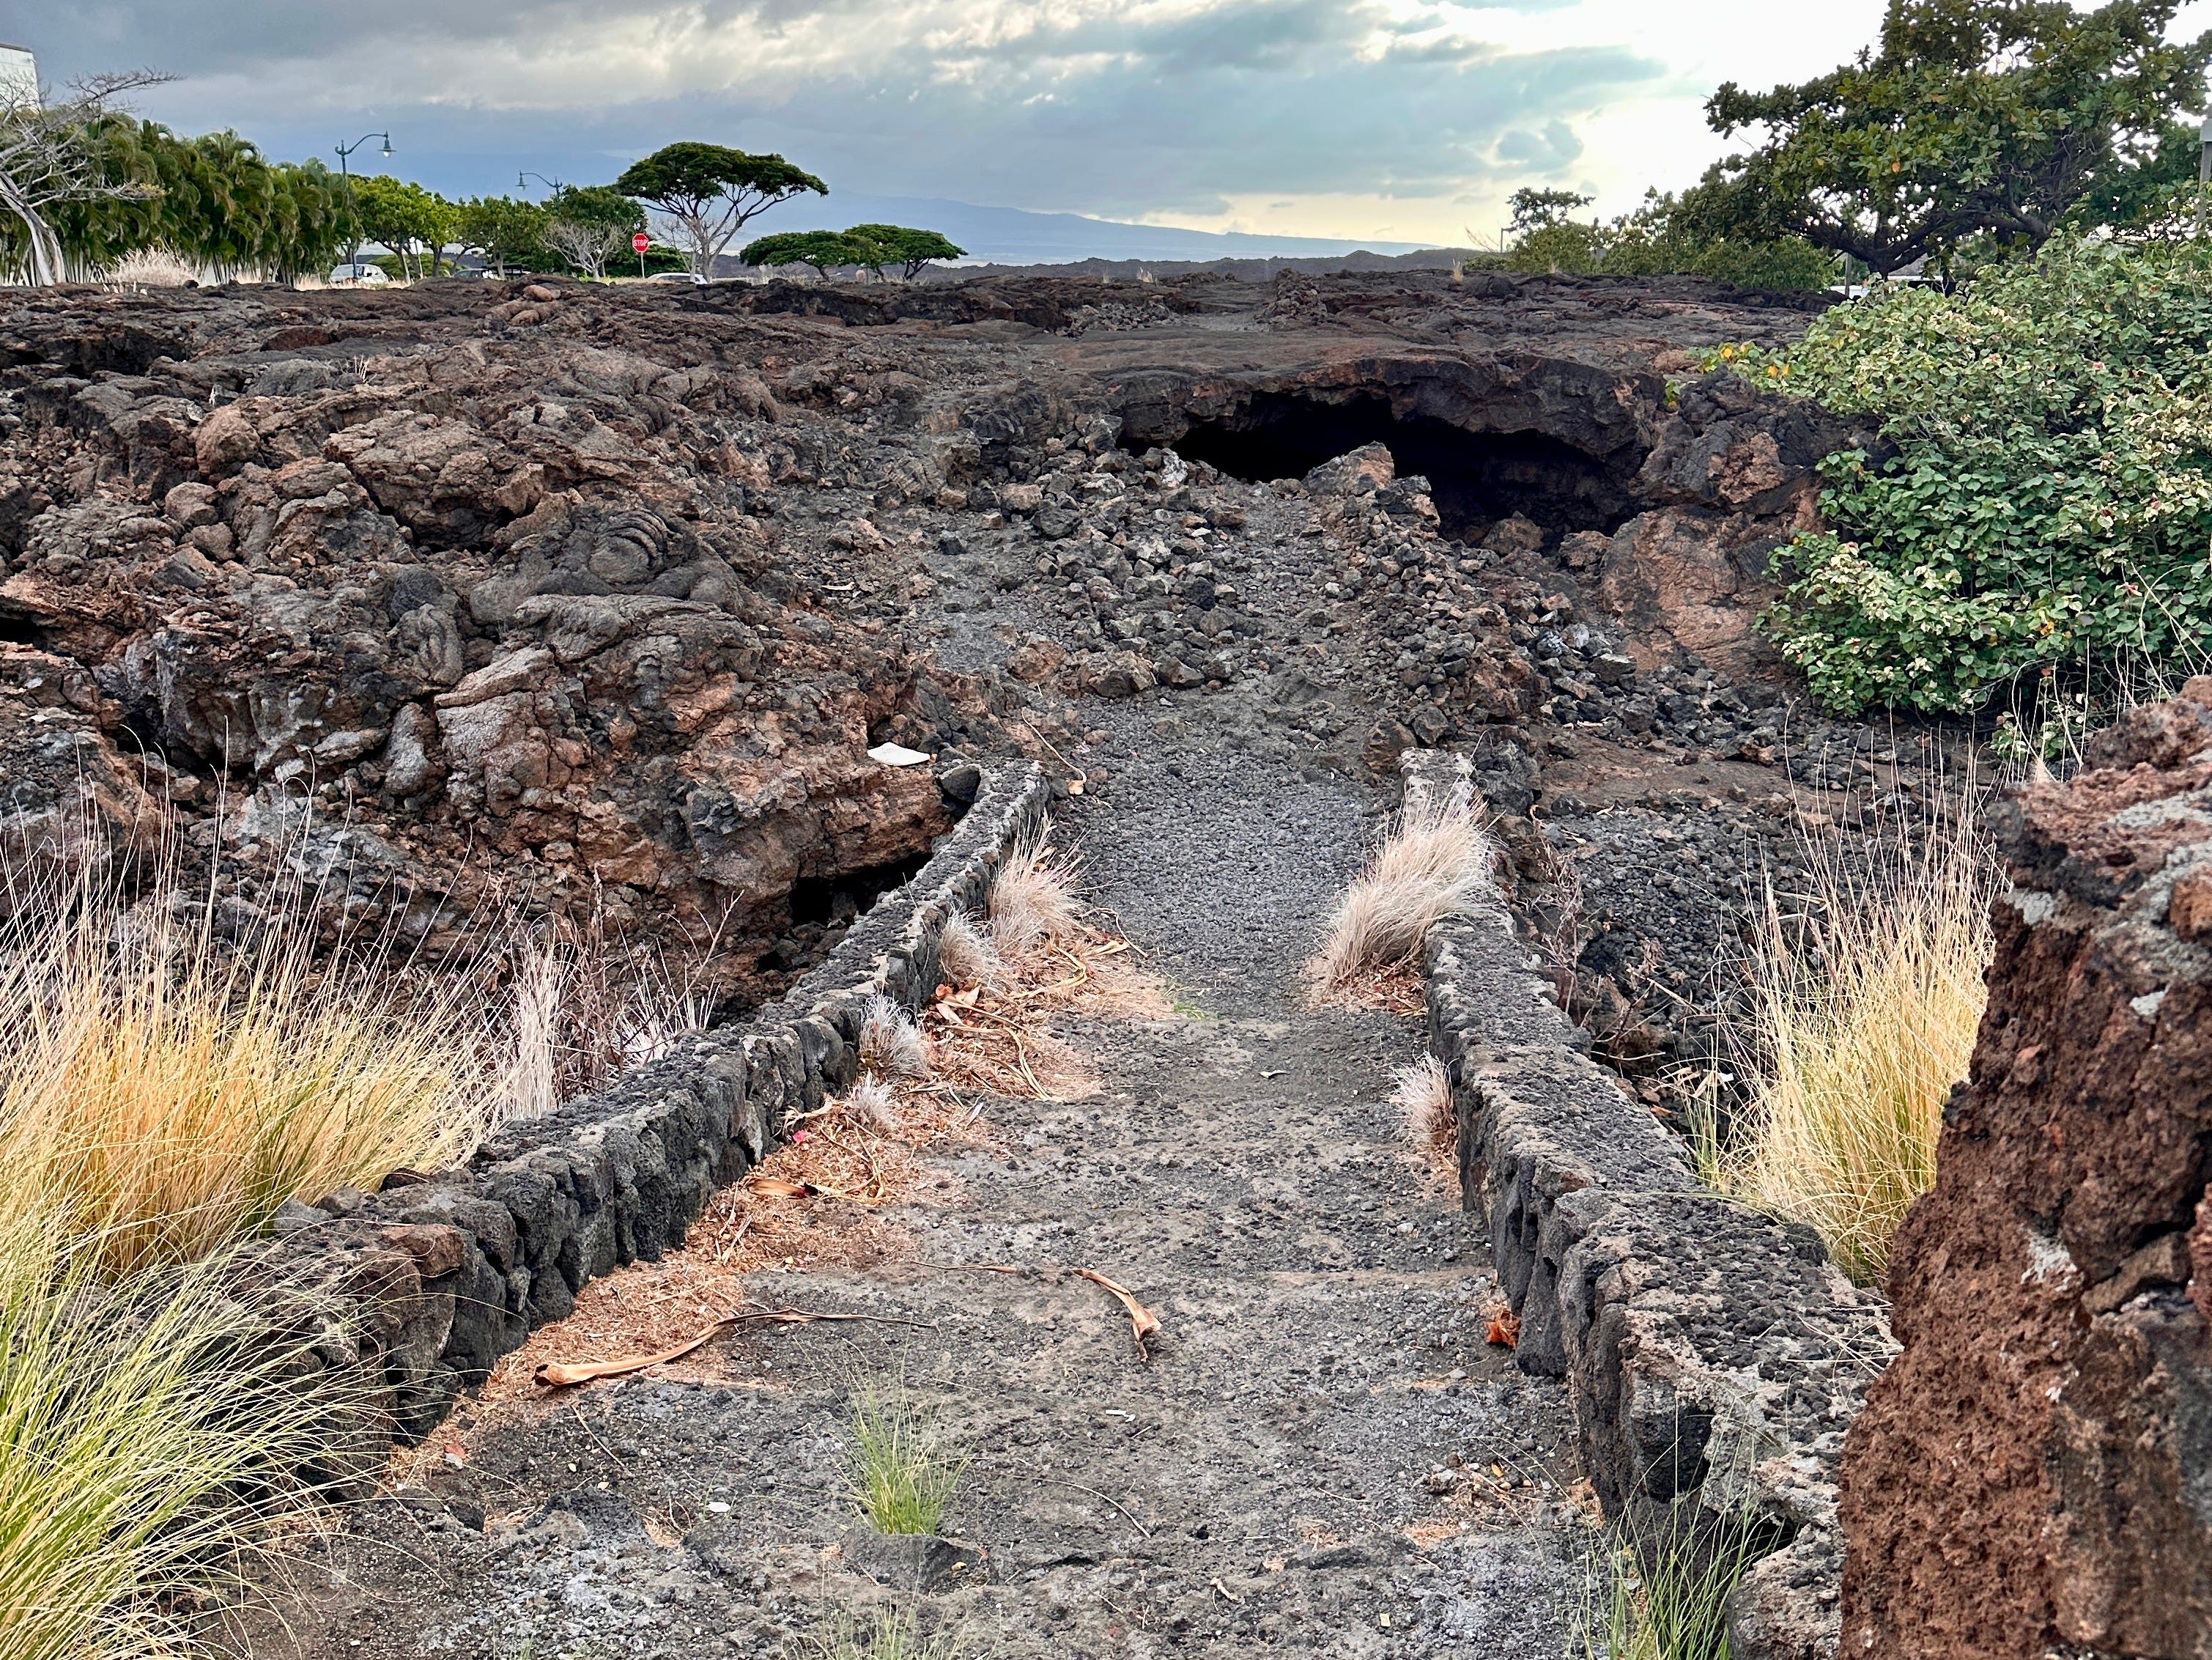
Volcanic rock fields, barren and lunar. Then suddenly: lush rainforest, dense with vegetation. Then open grassland. Then coastal areas with resort development. Then rural residential scattered across former lava flows.
You can drive from active volcano to rainforest to desert to ocean within an hour. Extreme microclimates exist side by side, separated by nothing more than which direction the trade winds blow.
I immediately thought about housing markets.
In Philadelphia, I can drive from a neighborhood with 95% occupancy and rising rents to a submarket three blocks away with 80% occupancy and flat rents. The fundamentals are the same—same city, same economic base, same policy environment. But conditions shift dramatically across a single boundary line.
Sometimes that boundary is a highway. Sometimes it’s a park. Sometimes it’s nothing physical at all—just perception, reputation, the accumulated weight of historical patterns that shape current decisions.
Understanding why conditions shift—and more importantly, when they’re likely to shift—is the entire game in real estate market analysis.
Hawaii made this visible in a way that felt almost instructional. The microclimates aren’t metaphorical; they’re literal. And the lesson translates directly: don’t assume uniformity. Examine the boundary conditions. Understand what creates the difference.
What the Data Doesn’t Tell You
Government data is essential for housing market analysis. HUD’s Small Area Fair Market Rents (SAFMRs), census data on household income and cost burden—these are the foundation of any serious market study.
But data always lags reality. By the time HUD publishes SAFMRs for a given year, they’re reflecting market conditions from 12-18 months prior. In fast-moving markets, that lag can mean the data is describing a market that no longer exists.
On the Big Island, I walked properties that looked solid on paper but told a different story on the ground. Deferred maintenance that wouldn’t show up in a database. Tenant mix that explained occupancy patterns the numbers alone couldn’t capture. Site characteristics that created operational challenges invisible in remote analysis.
This is why we walk into inspections with everything we need on our phones but still make the trip. You can’t compress the hours in a day, and you can’t replace boots-on-the-ground observation with data alone, no matter how sophisticated your analysis tools.
What I learned in Hawaii that applies everywhere: the data tells you what is happening. The site visit tells you why it’s happening and whether it’s likely to continue.
Both matter. Neither is sufficient alone.
The Consistency Beneath the Variation
Here’s what the site visit confirmed: the core dynamics matched what the preliminary analysis showed—and what I’ve seen in markets nationwide for three decades.
Supply constraints? Absolutely. And consistent with what I’ve analyzed in Boston, where zoning limits density, and San Antonio, where development costs are rising faster than rents in some submarkets.
Demand pressure? Certainly. Similar patterns to Montana’s resort towns, where seasonal workers compete for limited year-round rentals.
Policy lag? Without question. Government funding mechanisms and regulatory structures create the same challenges in Hawaii that they create in every market we operate in.
The on-site work didn’t reveal unexpected problems. It validated that the analysis was sound and added operational texture that only boots-on-the-ground observation provides.
Expansion and Strategic Timing
Last week’s announcements—San Antonio and the major brokerage contract—reflect the same evolution the Hawaii work demonstrates.
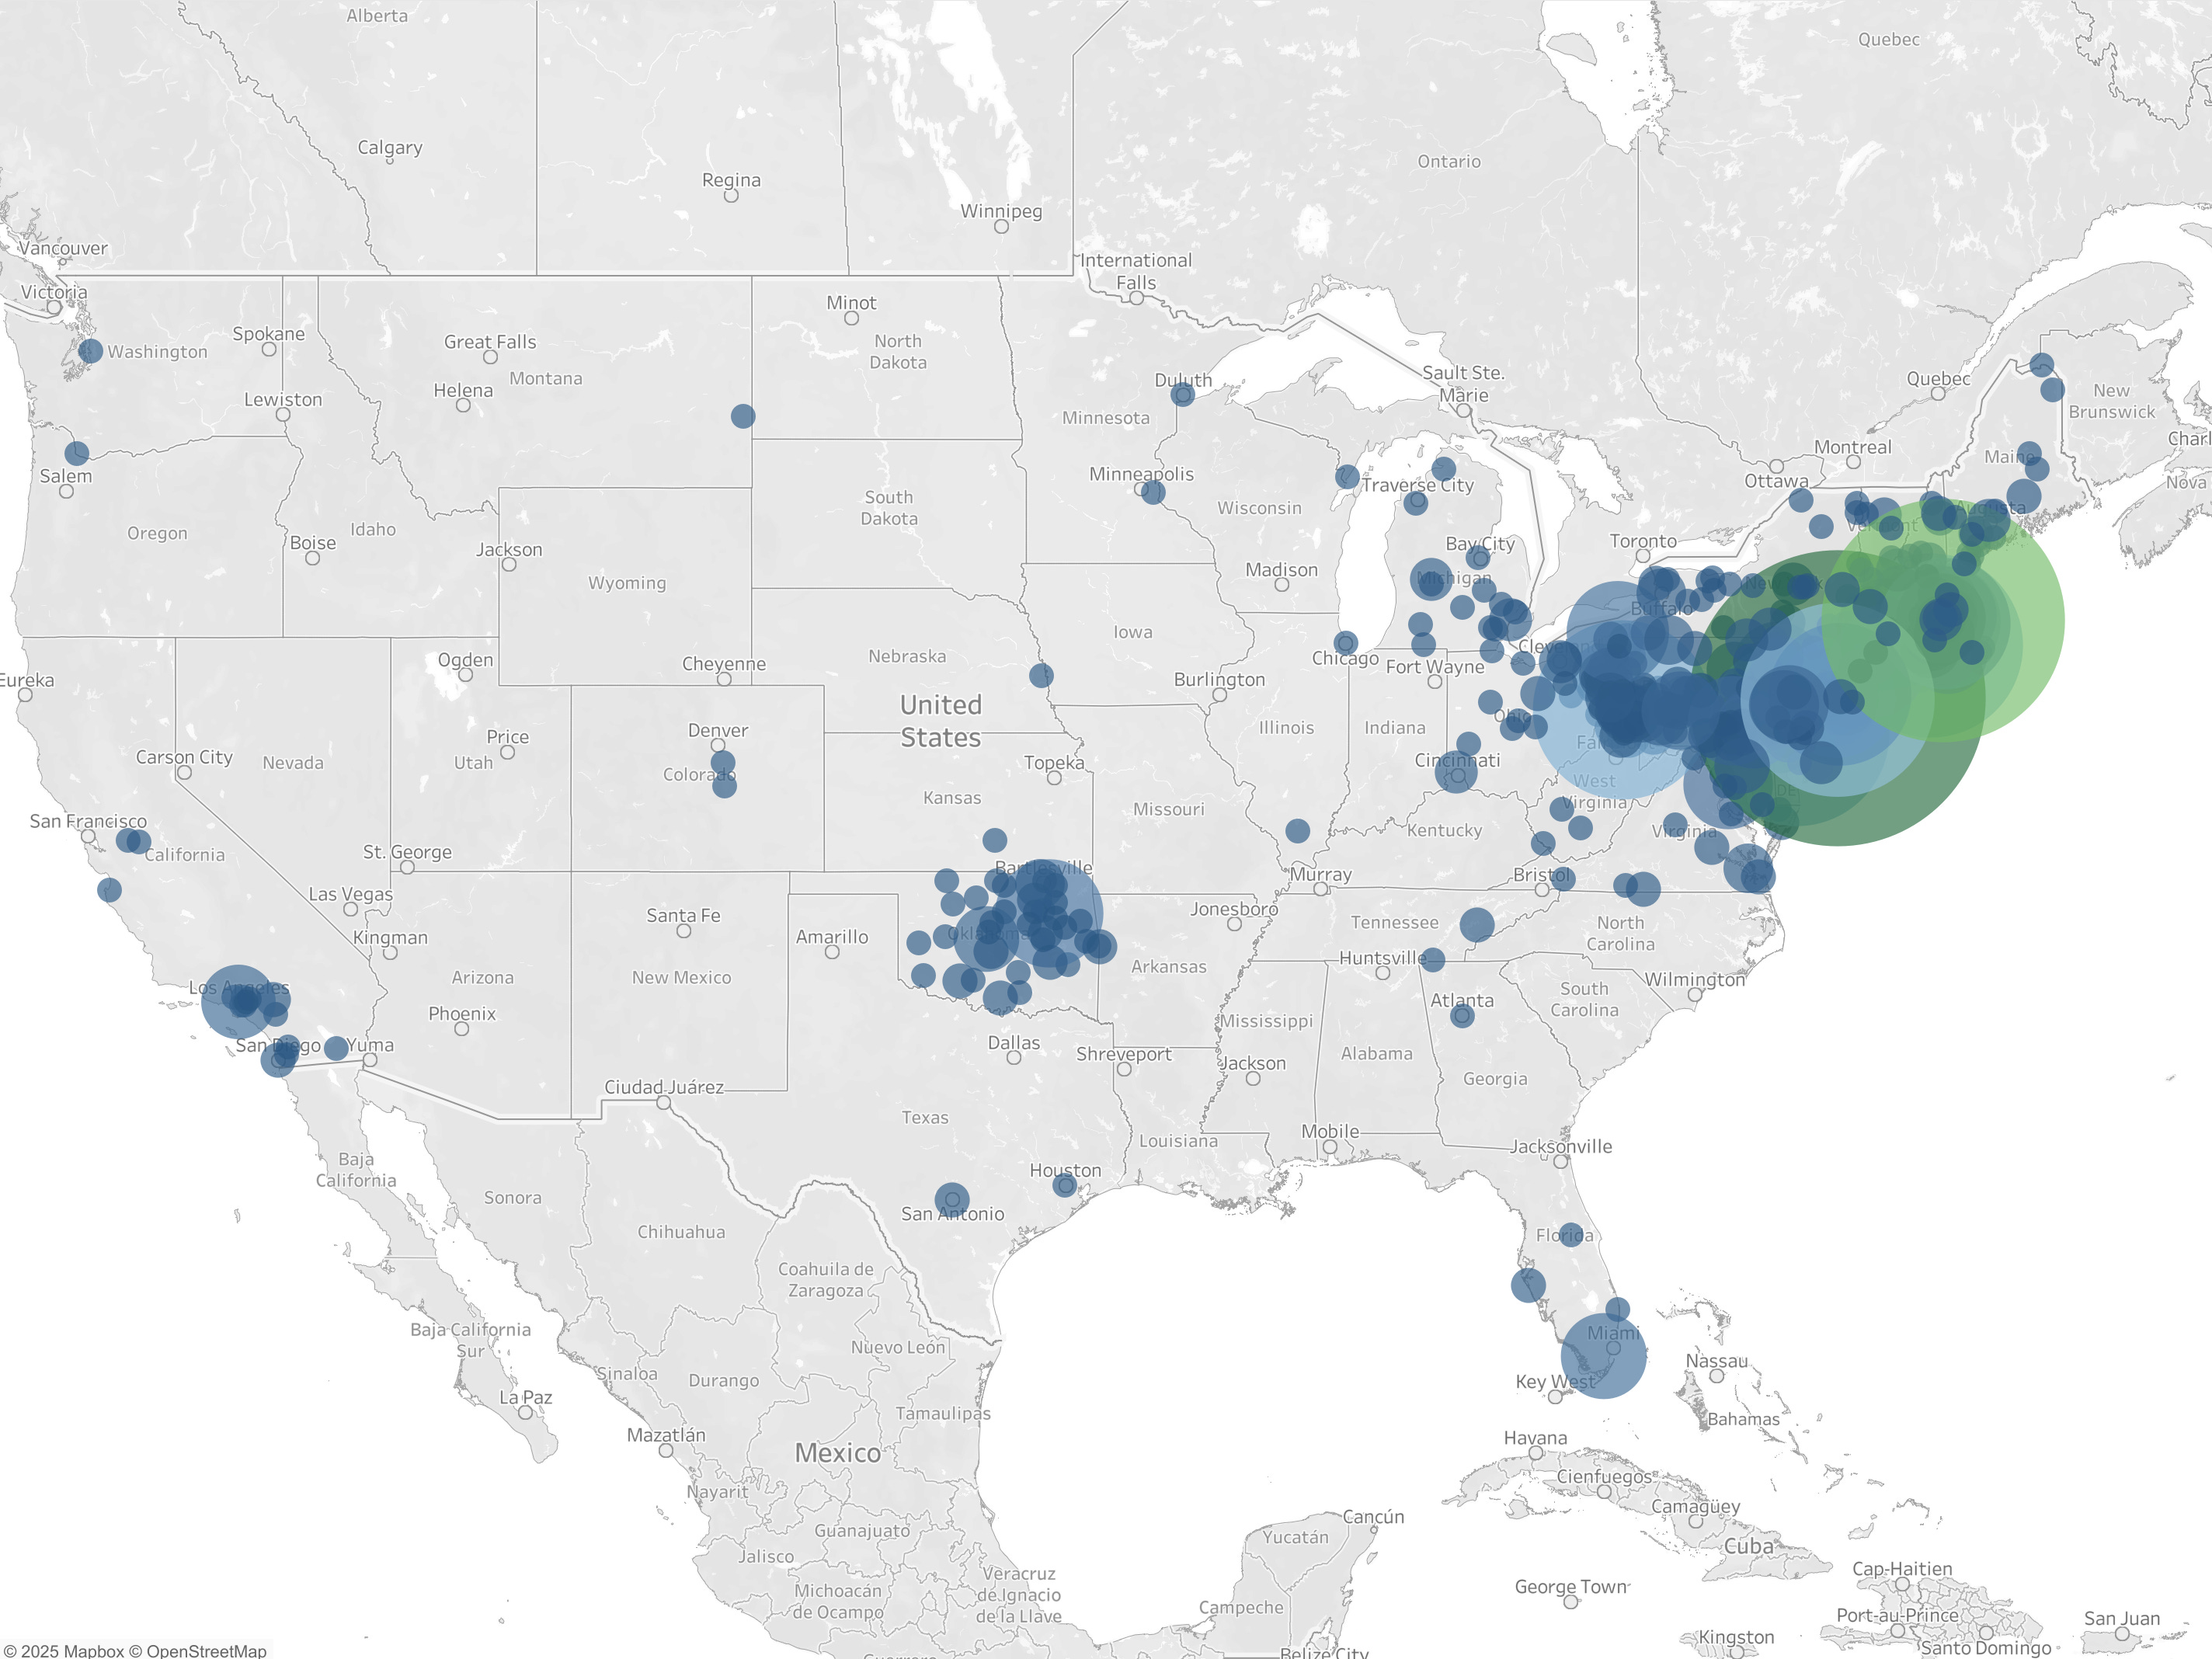
For 17 years, Clarendon has operated primarily in the Northeast. We’ve built deep expertise in markets from Boston to Philadelphia, with our more recent expansion into western markets in California, Oklahoma and Texas. That geographic focus has been a strength: we know these markets intimately.
But the housing landscape is changing. Housing authorities nationwide are facing similar challenges: aging portfolios, limited capital for improvements, pressure to preserve affordability while maintaining financial sustainability. The authorities that are navigating these challenges most successfully are looking for partners who can operate across markets, who understand patterns beyond local variation.
San Antonio Housing Authority is the largest housing authority in Texas and among the top 15 nationally. They serve nearly 27,000 families through public housing, Section 8, and mixed-income partnerships. They’re also one of only 17 housing authorities designated by HUD as “Moving to Work” authorities—a distinction given to high-performing agencies with the flexibility to innovate.
That’s the kind of client that chooses partners based on methodology and track record, not just local presence.
The major brokerage contract we signed this week represents a similar opportunity: working with a top 5 public housing authority on transactions that require both market intelligence and execution capability.
These opportunities feel overdue because the capability has been there. But they also feel carefully timed because the market conditions are right. Housing authorities are increasingly looking for partners who can provide comprehensive services—market analysis, brokerage, advisory—rather than fragmented point solutions.
Our Hawaii work reinforced a core principle: sound analytical methodology combined with thorough on-site inspection produces credible market analysis.
What Comes Next
As I write this, digesting the Hawaii work, the contrasts are instructive: island market to heartland metro, extreme scarcity to moderate constraints, resort context to urban core.
And yet: the fundamentals remain consistent.
We’re working on Clarendon’s first regular market report for rental housing owners and investors. It will synthesize rent data across multiple markets, identify patterns in rent trends and occupancy dynamics, and highlight opportunities where market conditions are shifting before they become obvious.
The Hawaii work will inform that report, not as a separate island section but as evidence of patterns that show up everywhere. Supply constraints that create upward pressure on achievable rents. Policy frameworks that lag market reality. Development feasibility challenges that require creative problem-solving.
The first report will drop in January. If you want to be notified when it’s available, drop a comment below or reach out directly.
The Lesson: Fresh Perspective Matters
Velocity and perspective both require willingness to expand into new markets—and the discipline to validate that your methodology holds up in unfamiliar territory.
I didn’t need to go to Hawaii to understand supply constraints or demand pressure or policy lag. I’ve been analyzing those dynamics for three decades. The preliminary analysis was sound before I boarded the plane.
But I needed to go to Hawaii to see them with fresh eyes. To test whether patterns I’ve observed in dozens of markets held up in a context with different constraints. To validate that methodology matters more than familiarity.
The Big Island confirmed what I expected: the fundamentals are consistent. The patterns translate. Sound methodology produces credible analysis across different market contexts.
“Don’t get so comfortable in familiar markets that you stop seeing them clearly.”
But the reminder was valuable: don’t get so comfortable in familiar markets that you stop questioning your assumptions. Don’t assume that local knowledge is a substitute for rigorous methodology. Don’t let 30 years of experience become 30 years of routine.
Stay willing to test your frameworks in new contexts—literal or figurative—to confirm that what you think you know is actually true.
Most of the time, it is.
But the discipline of proving it keeps the work sharp.
Eve Moss is the Founder and Managing Principal of Clarendon, a commercial real estate firm specializing in housing markets nationwide. With 30+ years of experience, she operates from New York, Boston, and Cleveland, serving housing authorities, investors, and policymakers.
For inquiries about market analysis, valuation, brokerage services, or strategic advisory, contact eve.moss@clarendon.com or visit clarendon.com.
Everything at evemoss.com → Market Intelligence. Mindful Living.
Subscribe to receive:
Quarterly market reports
Market intelligence updates
Analysis of housing policy changes
Insights from 30+ years in real estate